House prices are dictated by a range of factors, some within your control and some that unfortunately aren’t. The three main things that people look for when buying a new home are location, cost and condition, with the cost being largely determined by the other two factors.
Before putting their homes on the market, homeowners will want to make sure their properties are in the best condition possible, with all of the desirable conveniences and none of the doom-spelling issues like damp problems or structural damage.
By simply upgrading the main rooms in your home, you can make it a much more desirable proposition to potential buyers, adding huge value on to the price-tag in the process. For instance, installing a brand new kitchen or a new bathroom with a designer free-standing bath or installing some fresh and modern decorative mouldings can give your home a spark you never knew it had.
However, what you can’t change is the location of your property. Depending on where you live, you could be selling an almost identical property for a fraction of its objective value. While local amenities like schools and transport links can boost the value of a property, negative factors like crime rates and the perceived cleanliness of an area can cause them to plummet.
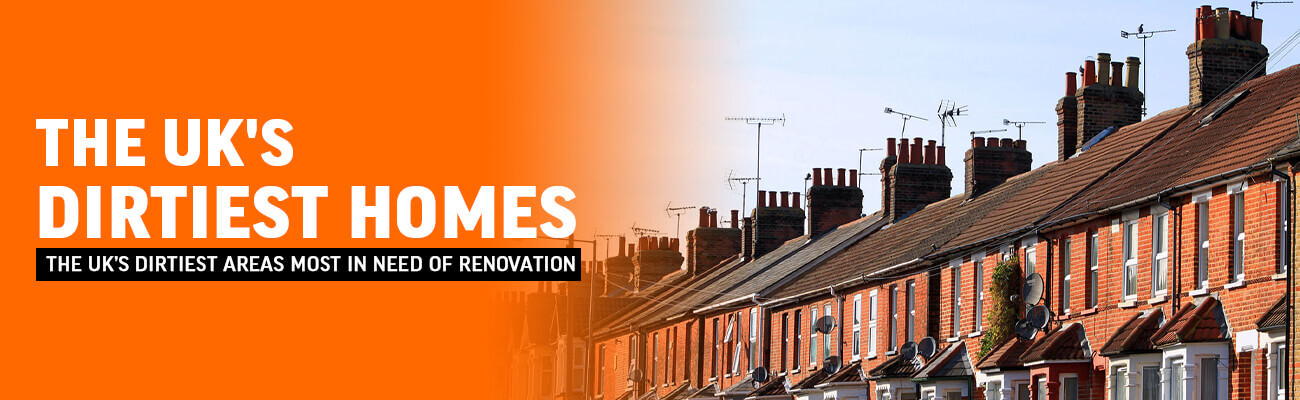
With this in mind, we at Buildworld were curious to find out which parts of the country have the worst problems when it comes to local cleanliness, so we conducted a study and have listed our findings of the cleanest and dirtiest places in the UK to live. Areas are ranked based on the number of dirty houses 2016-2020, fly-tipping incidents 2019/20 and Google searches in the last twelve months for house problems.
With a historic reputation for being one of England’s leading cities during the industrial revolution, it’s clear to see why Liverpool placed as England’s dirtiest city.
From 2016-2020, there were 23 complaints per 10,000 people in Liverpool of dirty, derelict or verminous houses.
Liverpool’s local authority noted a total of 116 fly-tipping incidents per 10,000 during 2019/20. These cases of fly-tipping were found in private residential areas and back alleys across the city.
Plymouth, the seaside city on England’s south coast, is more affected by house issues than most other areas in the UK!
The Plymouth local authority reported 13 complaints of dirty, derelict or verminous properties in the past 5 years, for every 10,000 residents. They also recorded 410 total incidents of fly-tipping in private areas and back alleys from 2019-2020.
In Plymouth, there were 428 Google searches in the last year per 10,000, for common house problems, showing the city is affected by issues including leaking roofs.
The second seaside location to appear in the top-three, Blackpool is one of the dirtiest places in the country.
The Blackpool local authority reported that 13 complaints were received about dirty, derelict or verminous houses from 2016-2020 for every 10,000 residents.
There were 188 incidents of fly-tipping around private homes and back alleys that were recorded by the local authority from 2019-2020.
Blackpool’s residents made plenty of Google searches related to dirty homes in the last year ...
In Brighton, England’s least-dirty city in terms of common house problems, there were 2 complaints for every 10,000 people, about dirty, derelict or verminous properties from 2016-2020.
Brighton local authority reported 11 incidents of fly tipping around homes from 2019-2020. This figure may be lower than other areas since some local authorities only reported fly tipping incidents that were recorded by council staff.
In Brighton there were just 356 google searches per 10,000 people made over the last 12 months, relating to house problems like dirt and dampness.
Gloucester is one of England’s least-dirty cities, with only 1 complaint of dirty, derelict or verminous houses since 2016, per 10,000 people.
There were just 2 incidents of fly tipping, per 10,000 people, in residential areas and back alleys from 2019-2020.
Residents of Gloucester made 431 google searches, per 10,000 residents, for dirty house problems in the past 12 months - the least out of all cities!
There was only 1 complaint per 10,000 people from 2016-2020 in Southend-on-Sea about dirty, derelict or verminous houses.
Southend-on-Sea ranks as one of England’s cleanest cities overall, thanks to its low number of residential fly tipping incidents. The local authority reported around 1 case of fly tipping around houses from 2019-2020, per 10,000 residents. This figure may be lower than other areas since some councils relied solely on staff reports for reported fly tipping incidents.
In Southend-on-Sea there were 448 google searches, per 10,000 people, made in the last 12 months relating to common house problems and how to fix them.
|
|
Local authority |
|
|
|
|
|---|
Not all areas in London are equally as dirty - Enfield stands out as London’s filthiest borough.
There were 43 complaints of dirty, derelict or verminous properties in Enfield, for every 10,000 people, between 2016 and 2020 - higher than any other area in England!
The Enfield local authority reported just 1.6 fly-tipping incidents for every 10,000 people from 2019-2020.
However, the Enfield council website makes it easy for residents to report issues like fly tipping in their area.
Merton ranks as one of London’s dirtiest boroughs. The Merton local authority only reported that 1 complaint was made of dirty, derelict or verminous homes from 2016-2020 for every 10,000 residents.
In contrast there were over 63.9 fly-tipping incidents per 10,000 people between 2019 and 2020 in Merton borough! That’s more than any other London borough.
In 2019 the Merton council received concerns from residents regarding dirty streets and houses. They pledged to improve waste collection and increase communication between the local authority and Merton citizens.
In Greenwich, there were 12 complaints of dirty, derelict or verminous homes for every 10,000 people, between 2016-2020!
With a total of over 29.2 residential and back alley fly-tipping incidents per 10,000, it’s easy to see how Greenwich is one of London’s dirtiest areas.
Sutton is London’s cleanest borough, with the least amount of dirty homes and litter dumping overall!
The Sutton local authority received just 0.2 complaints of dirty, derelict or verminous houses for every 10,000 people between 2016 and 2020. In total, 5 complaints of dirty houses in the city were received.
There were also only 0.1 records of fly tipping in back alleys and residential areas, per 10,000, from 2019-2020.
If you live in Lewisham, it might not surprise you to see it place as one of London’s cleanest neighbourhoods.
With only 0.4 complaints of dirty, derelict or verminous houses from 2016-2020, it’s easy to see why Lewisham is one of the least-dirty boroughs.
There were just 1.1 fly tipping incidents in residential areas and back alleys recorded by the local authority between 2019 and 2020, for every 10,000 people.
In Richmond upon Thames, there were 0.7 complaints recorded by the local authority, which related to dirty or vermin-infested houses for every 10,000 residents.
From 2019-2020, the local authority in Richmond upon Thames reported 0.9 fly tipping incidents around homes per 10,000 people.
|
|
Local authority |
|
|
|
|---|
In response to residential complaints about fly tipping and dirty, derelict or verminous houses across the country, the government has introduced some programmes to clean England’s neighbourhoods.
In 2021, the government allocated £57.8 million to local councils to develop derelict land into quality residential housing to boost communities. This year the government also introduced the new Right to Regenerate which allows members of the public to convert vacant plots of land and derelict or abandoned buildings into homes or community spaces.
These initiatives aimed at cleaning streets and resolving common housing problems hope to make dirty neighbourhoods more inviting and attractive for residents.
Your house can stand out as a beacon of beauty and excellence with Buildworld’s help. Our extensive line of products is designed to be easy to clean and maintain and look fantastic in any and every decor style. Mix and match with a wide range of fire doors, Internal French Doors, roof windows and External Composite Doors to create the perfect look for your living space.
Freedom of Information Act 2000 requests (FOIs) were sent to 83 Local Authorities operating across the UK. 44 of the local authorities responded with data indicating the number of dirty, derelict or verminous properties from 2016-2020.
A list of 72 search terms related to common house problems, such as ‘damp in home’ and ‘leaking ceiling’, was compiled. The number of searches for each city and borough in the past 12 months was recorded using Google Keyword Planner.
The fly tipping incidents and actions taken, reported by local authorities in England 2012/13 to 2019/20 dataset was used to find the total number of fly-tipping incidents in residential areas and back alleys for each city and borough. Around 13% of all local authorities provided figures based solely on customer and staff reports, accounting for any data discrepancies.
We then gave each town, city or borough a normalised score out of ten on each factor, before taking a final average score across all factors.