The areas in the UK most at-risk of weather destruction
Flooding has always been a risk for Brits. In October and November 2019 there were 70 flood warnings issued across England, and some areas saw a month's worth of rainfall in just one day.
With flood risks coming from rivers, surface water and the coastline, it can be hard to know how high the risk of flooding is in your area. Flood protection methods have been introduced by councils across the UK, however, with some building materials and tools you can decrease the risk of floods at your property.
Buildworld have investigated the amount of rainfall since 2018 alongside the percentage of properties at risk of flooding in areas across the UK, to determine which locations have the highest flooding risk. Read until the end for some information on how to best protect your home.
The risk of flooding in areas across the UK
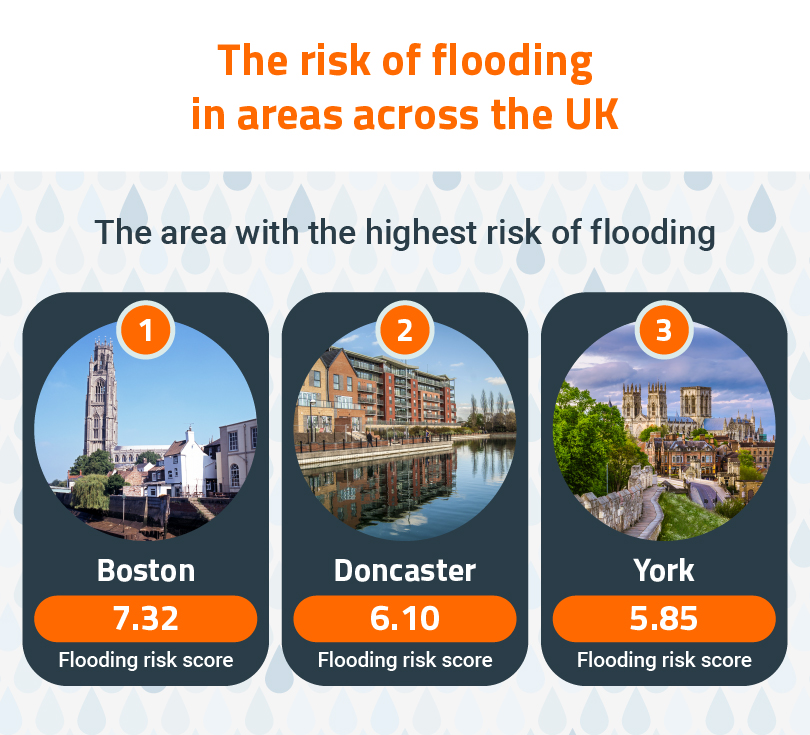
The area with the highest risk of flooding: Boston | Score: 7.32
Boston stands out as the area in the UK with the highest risk of flooding.
Flood risks in Lincolnshire are generally higher than in the rest of the country, especially in coastal towns like Boston, due to the high risk of tides and the rising water level of the sea.
Of all the properties in Boston, 30% are currently at high risk of flooding, which is higher than in any other UK area. The National Audit Office declared these properties with a risk of 1% or higher as ‘high risk'.
Based on historical records of rainfall at Boston's closest weather station, Waddington, the Met Office predicts the town will get an average of 53mm of rainfall per month in 2021.
Compared to 2018, when the monthly average amount of rainfall was 49.5mm, this indicates the flooding risk in Boston is on the rise.
Doncaster | Score: 6.10
Doncaster's high risk of flooding may come as no surprise after the 2019 floods caused many homes across the town to be affected by water damage.
In Doncaster, 12% of all homes have been classified as at serious risk of flooding, particularly around the River Don which flows through Yorkshire.
The Met Office estimates a monthly average of 66mm of rain through 2021. Although higher than the figure for Boston, the prediction is 10mm less than the amount of rainfall the previous year.
York | Score: 5.85
York is one of the UK areas most affected by flooding, with over 3% of all homes classed as at significant risk of facing floods.
A measure to protect residents, the York Foss flood barrier, which was originally constructed in the 1980s, is currently being reconstructed.
The level of rainfall this year is estimated to be around 76mm per month on average, which is one of the highest across the UK.
Highest percentage of properties at risk of flooding: Boston | 30.8%
In Boston, the UK's highest risk area for flooding, over 30% of homes are classed as at high risk of flood damage.
The risk comes mostly from tidal waters despite the completion of the Boston Barrier in 2020, which reinforced embankments around the river.
Highest predicted amount of rainfall per month 2021: Plymouth | 77.1mm
Plymouth is the UK city with the highest amount of predicted rainfall this year. The closest weather station in Camborne is estimated to get around 77mm of rain each month.
Plymouth is 7th on our list, with just 0.6% of properties at serious risk of flooding in 2020.
The risk of flooding in areas across the UK
| Rank | Area |
|
|
|
|---|---|---|---|---|
| 1 | Boston | 30.8% | 53mm | 7.32 |
| 2 | Doncaster | 12.6% | 66mm | 6.10 |
| 3 | York | 3.1% | 76.2mm | 5.85 |
| 4 | Leeds | 2.6% | 76.2mm | 5.78 |
| 5 | Harrogate | 2.1% | 76.2mm | 5.71 |
| 6 | Wakefield | 1.9% | 76.2mm | 5.68 |
| 7 | Plymouth | 0.6% | 77.1mm | 5.59 |
| 8 | Blackpool | 0.8% | 76.2mm | 5.52 |
| 9 | Bradford | 0.6% | 76.2mm | 5.49 |
| 10 | Kingston upon Hull | 16.8% | 53mm | 5.27 |
| 11 | Sheffield | 2.7% | 66mm | 4.66 |
| 12 | Portsmouth | 4.4% | 63.3mm | 4.61 |
| 13 | Exeter | 11.9% | 52.6mm | 4.51 |
| 14 | Manchester | 1% | 66mm | 4.41 |
| 15 | Isle of Wight | 2.3% | 63.3mm | 4.31 |
| 16 | Southampton | 2.1% | 63.3mm | 4.28 |
| 17 | Reading | 4.9% | 59.1mm | 4.21 |
| 18 | Oxford | 4.3% | 59.1mm | 4.12 |
| 19 | Peterborough | 3.7% | 59.1mm | 4.04 |
| 20 | Kingston upon Thame | 7.0% | 53.8mm | 3.94 |
| 21 | Slough | 5.9% | 53.8mm | 3.77 |
| 22 | Eastbourne | 2.7% | 56.8mm | 3.64 |
| 23 | Milton Keynes | 0.6% | 59.1mm | 3.58 |
| 24 | Newcastle upon Tyne | 0.3% | 58.5mm | 3.48 |
| 25 | Lincoln | 4.4% | 53mm | 3.46 |
| 26 | Merton | 3.5% | 53.8mm | 3.42 |
| 27 | Croydon | 3% | 53.8mm | 3.35 |
| 27 | Enfield | 3% | 53.8mm | 3.35 |
| 29 | Bromley | 2.9% | 53.8mm | 3.34 |
| 29 | Waltham | 2.9% | 53.8mm | 3.34 |
| 31 | Lewisham | 2.8% | 53.8mm | 3.32 |
| 32 | Brent | 2.5% | 53.8mm | 3.28 |
| 33 | Stoke-on-Trent | 2.8% | 53mm | 3.23 |
| 34 | Richmond upon Thame | 2.1% | 53.8mm | 3.22 |
| 35 | Sutton | 2% | 53.8mm | 3.20 |
| 36 | Harrow | 1.9% | 53.8mm | 3.19 |
| 36 | Hillingdon | 1.9% | 53.8mm | 3.19 |
| 38 | Redbridge | 1.7% | 53.8mm | 3.16 |
| 39 | Leicester | 6.2% | 47.4mm | 3.10 |
| 40 | Barnet | 1.2% | 53.8mm | 3.09 |
| 41 | Newham | 1.1% | 53.8mm | 3.07 |
| 41 | Wandsworth | 1.1% | 53.8mm | 3.07 |
| 43 | Derby | 5.8% | 47.4mm | 3.05 |
| 44 | Ealing | 0.9% | 53.8mm | 3.04 |
| 45 | Bexley | 0.7% | 53.8mm | 3.01 |
| 45 | Havering | 0.7% | 53.8mm | 3.01 |
| 47 | Lambeth | 0.6% | 53.8mm | 3.00 |
| 48 | Hounslow | 0.5% | 53.8mm | 2.99 |
| 48 | Barking | 0.5% | 53.8mm | 2.99 |
| 48 | Dagenham | 0.5% | 53.8mm | 2.99 |
| 51 | Bristol | 1.5% | 52.6mm | 2.99 |
| 52 | Wolverhampton | 1.1% | 53mm | 2.98 |
| 53 | Greenwich | 0.4% | 53.8mm | 2.97 |
| 53 | Haringey | 0.4% | 53.8mm | 2.97 |
| 55 | Tower Hamlet | 0.3% | 53.8mm | 2.96 |
| 56 | Liverpool | 0.7% | 53mm | 2.92 |
| 57 | Camden | 0% | 53.8mm | 2.91 |
| 57 | Westminster | 0% | 53.8mm | 2.91 |
| 57 | Hackney | 0% | 53.8mm | 2.91 |
| 57 | Hammersmith & Fulham | 0% | 53.8mm | 2.91 |
| 57 | Islington | 0% | 53.8mm | 2.91 |
| 57 | Kensington & Chelsea | 0% | 53.8mm | 2.91 |
| 63 | Nottingham | 3% | 47.4mm | 2.64 |
| 64 | Cambridge | 2.2% | 48.2mm | 2.61 |
| 65 | Birmingham | 1.8% | 47.4mm | 2.46 |
| 66 | Coventry | 1.1% | 47.4mm | 2.36 |
| 67 | Great Yarmouth | 1.8% | 36.6mm | 1.26 |
| 68 | Norwich | 0.1% | 36.6mm | 1.01 |
The risk of rain destruction in areas across the UK
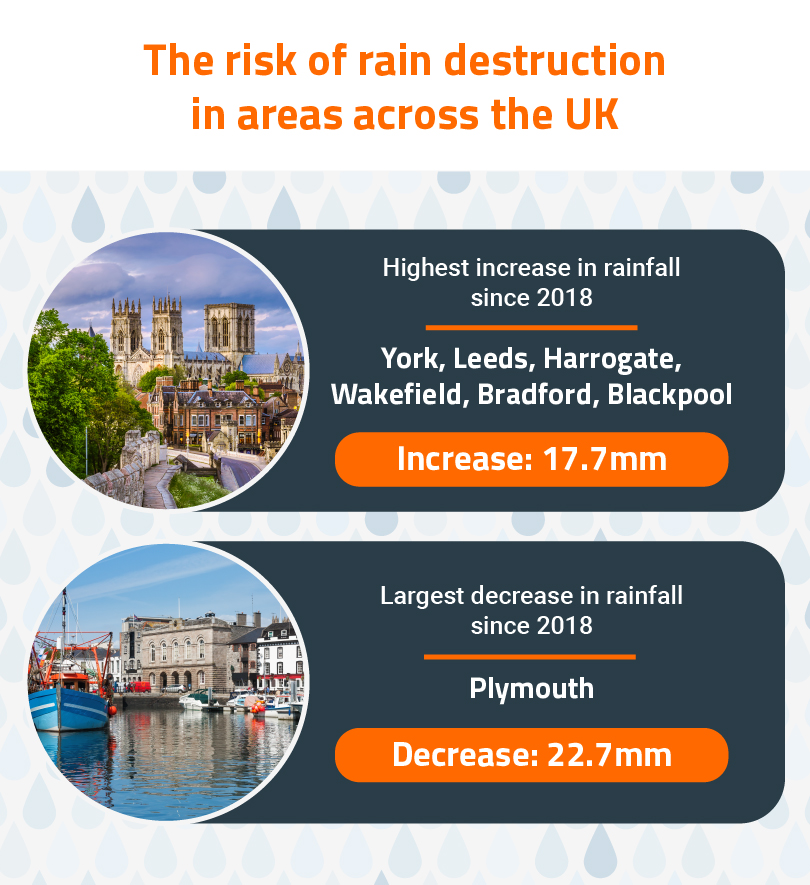
Highest increase in rainfall since 2018: York, Leeds, Harrogate, Wakefield, Bradford, Blackpool | Increase: 17.7mm
The highest increase in rainfall over the last few years can be seen around the Yorkshire region. For these areas, the closest weather station on the Met Office's data records is Bradford.
In 2018, Bradford weather station recorded 58.5mm of rainfall on average per month, and it increased in 2019 to 86mm. In 2020, the level of rainfall peaked at 92.3mm, yet the figure is predicted to drop slightly to 76mm this year.
Largest decrease in rainfall since 2018: Plymouth | Decrease: 22.7mm
Plymouth is the area with the biggest decline in the risk of rainfall since 2018. The closest weather station to Plymouth, Camborne, reported almost 100mm of rainfall as a monthly average in 2018.
In 2019 the amount of rain increased to almost 105mm on average per month, however, it has since been declining and is estimated to be 77mm in 2021.
Areas with the most rain increase across the UK
| Average monthly rainfall(mm) | ||||||
| Rank | Area | 2018 | 2019 | 2020 |
|
|
| 1 | York | 58.5mm | 86mm | 92.3mm | 76.2mm | 17.7mm |
| 1 | Leeds | 58.5mm | 86mm | 92.3mm | 76.2mm | 17.7mm |
| 1 | Harrogate | 58.5mm | 86mm | 92.3mm | 76.2mm | 17.7mm |
| 1 | Wakefield | 58.5mm | 86mm | 92.3mm | 76.2mm | 17.7mm |
| 1 | Blackpool | 58.5mm | 86mm | 92.3mm | 76.2mm | 17.7mm |
| 1 | Bradford | 58.5mm | 86mm | 92.3mm | 76.2mm | 17.7mm |
| 7 | Peterborough | 41.5mm | 47.5mm | 55.3mm | 59.1mm | 17.6mm |
| 8 | Newcastle upon Tyne | 47mm | 60.9mm | 58.7mm | 58.5mm | 11.5mm |
| 9 | Reading | 48.9mm | 60.5mm | 67.8mm | 59.1mm | 10.1mm |
| 9 | Oxford | 48.9mm | 60.5mm | 67.8mm | 59.1mm | 10.1mm |
| 9 | Milton Keynes | 48.9mm | 60.5mm | 67.8mm | 59.1mm | 10.1mm |
| 12 | Cambridge | 41.5mm | 47.5mm | 55.3mm | 48.2mm | 6.7mm |
| 13 | Slough | 48.3mm | 54.4mm | 55.2mm | 53.8mm | 5.5mm |
| 13 | London (all boroughs) | 48.3mm | 54.4mm | 55.2mm | 53.8mm | 5.5mm |
| 15 | Boston | 49.5mm | 68.2mm | 66.1mm | 53mm | 3.5mm |
| 15 | Kingston upon Hull | 49.5mm | 68.2mm | 66.1mm | 53mm | 3.5mm |
| 15 | Lincoln | 49.5mm | 68.2mm | 66.1mm | 53mm | 3.5mm |
| 18 | Leicester | 44.7mm | 70.5mm | 57.4mm | 47.4mm | 2.7mm |
| 18 | Derby | 44.7mm | 70.5mm | 57.4mm | 47.4mm | 2.7mm |
| 18 | Nottingham | 44.7mm | 70.5mm | 57.4mm | 47.4mm | 2.7mm |
| 18 | Birmingham | 44.7mm | 70.5mm | 57.4mm | 47.4mm | 2.7mm |
| 18 | Coventry | 44.7mm | 70.5mm | 57.4mm | 47.4mm | 2.7mm |
| 23 | Doncaster | 66.5mm | 92.2mm | 76mm | 66mm | -0.6mm |
| 23 | Sheffield | 66.5mm | 92.2mm | 76mm | 66mm | -0.6mm |
| 23 | Manchester | 66.5mm | 92.2mm | 76mm | 66mm | -0.6mm |
| 26 | Eastbourne | 60.9mm | 71.1mm | 57.3mm | 56.8mm | -4.1mm |
| 27 | Exeter | 56.8mm | 63.4mm | 65.9mm | 52.6mm | -4.2mm |
| 27 | Bristol | 56.8mm | 63.4mm | 65.9mm | 52.6mm | -4.2mm |
| 29 | Portsmouth | 68.7mm | 78.2mm | 79.2mm | 63.3mm | -5.4mm |
| 29 | Isle of Wight | 68.7mm | 78.2mm | 79.2mm | 63.3mm | -5.4mm |
| 29 | Southampton | 68.7mm | 78.2mm | 79.2mm | 63.3mm | -5.4mm |
| 32 | Great Yarmouth | 46.2mm | 51.9mm | 57.8mm | 36.6mm | -9.6mm |
| 32 | Norwich | 46.2mm | 51.9mm | 57.8mm | 36.6mm | -9.6mm |
| 34 | Stoke-on-Trent | 70.5mm | 68.2mm | 66.1mm | 53mm | -17.5mm |
| 34 | Wolverhampton | 70.5mm | 68.2mm | 66.1mm | 53mm | -17.5mm |
| 34 | Liverpool | 70.5mm | 68.2mm | 66.1mm | 53mm | -17.5mm |
| 37 | Plymouth | 99.8mm | 104.8mm | 98.7mm | 77.1mm | -22.7mm |
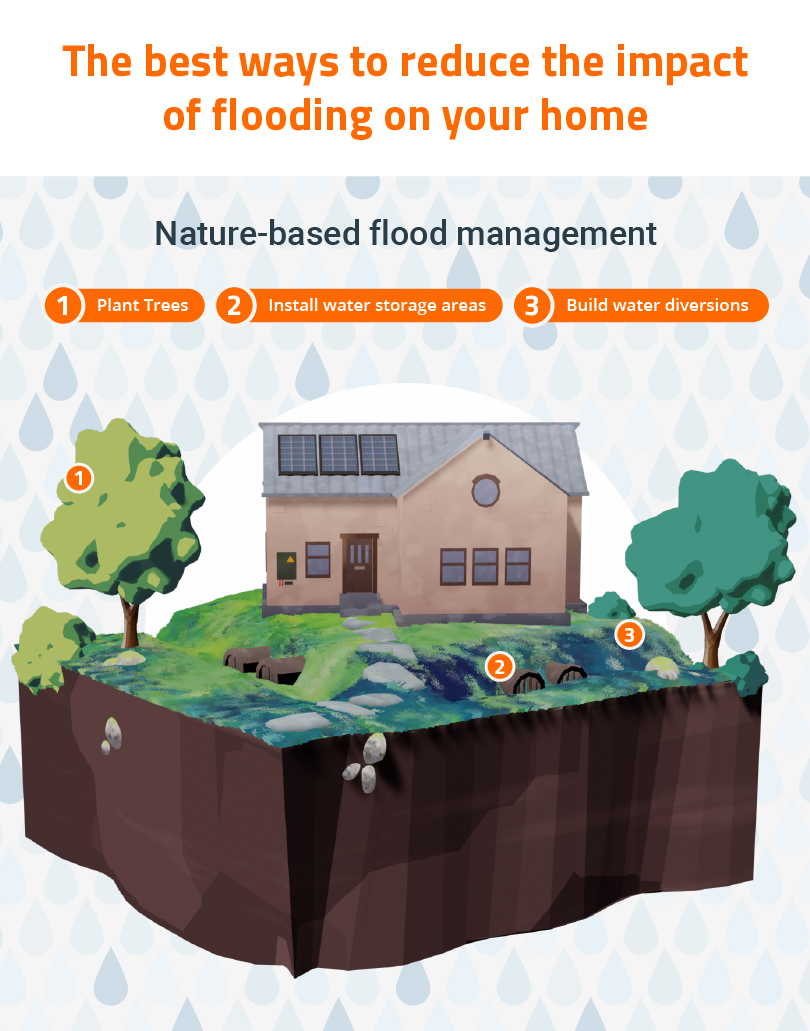
The best ways to reduce the impact of flooding on your home
Nature-based flood management
Natural flood prevention can be a vital first step towards reducing your risk of flooding. It involves taking small measures to reduce the water level of nearby rivers, giving you more time to prepare in the case of flooding.
These methods require no specialist equipment, so can be used by everyone.
- Plant Trees: Planting trees, hedges and plants reduces CO2 in the atmosphere and the effects of climate change. In recent years, climate change has led to melting ice caps which raise sea levels. On a more local scale, planting trees increases the water absorption in your area through tree roots, helping slow the rate of water flow into rivers.
- Install water storage areas: Below-ground reservoirs are the perfect way to reduce the flooding risk around your property. Water tanks or reservoirs can be built or purchased and used to release floodwater.
- Build water diversions: Alternatively to storing water, employing methods to drain water away from your property can save your home in the case of a flood. A french drain or catch basin can divert surface water away from your property, keeping your foundations dry.
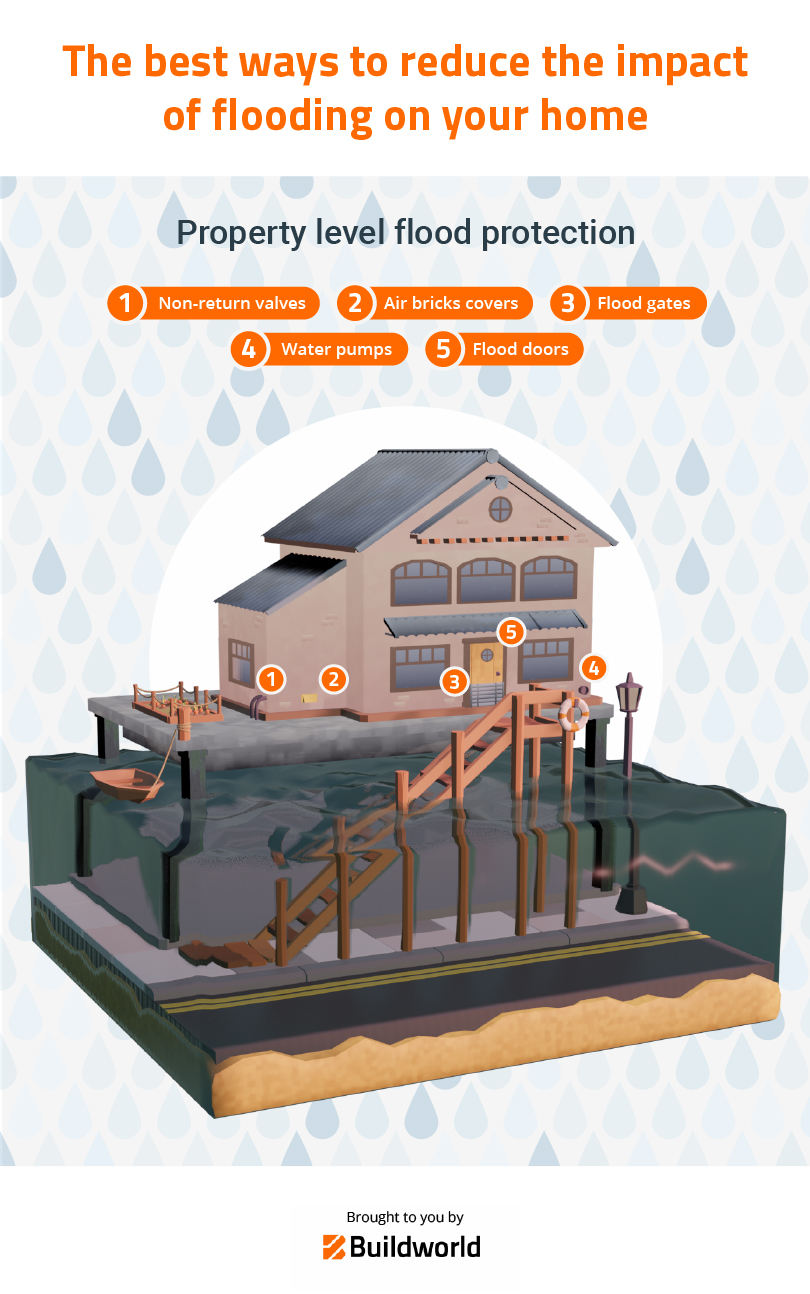
Property level flood protection
Property level flood protection comes in two forms: resilience and resistance. Resilience measures work to reduce the impact of flooding after the water enters the property. Resistance protection measures aim to prevent water from entering the house.
These measures are cost-effective and essential to ensure you can get back inside your home as quickly and easily as possible.
- Non-return valves: NRVs can be fitted in the drains in your home, and prevent flood water and sewage water from backing up into your property. They ensure water only flows in one direction down the pipe, no matter the water pressure.
- Air bricks covers: Covering your air bricks is one of the easiest ways to prevent flood damage. You can get covers for your air bricks to use during a flood, however, these must be removed at other times to prevent dampness. Automatically closing air bricks are one solution, which is designed to cut off flow when they detect water.
- Flood gates: Barriers and gates can be installed around your home, to doors, windows and other openings which would otherwise let in floodwater. The flood gates provide a water-tight barrier so no water can enter the house.
- Water pumps: When facing flash flooding, it is essential to respond quickly, so having a water pump is vital. Pumps can stop water pooling and pump away water quickly. They are extremely useful to prevent rising groundwater from entering through the floor
- Flood doors: An alternative to flood gates is flood doors. These are automatic, self-closing doors that require no human to activate them. The flood barrier rises when water reaches a certain level and locks to create a seal.
Methodology
Build World compiled a list of areas in the UK at risk of flooding from Safesite and also included some major UK cities.
Data was taken from the National Audit Office on the number of properties in the Upper Authority that had a >1% risk of flooding in 2020.
The Met Office's data revealed the level of rainfall each month from the years 2018-2021 at various weather stations. Each area in the UK was matched to a weather station, by using coordinates to determine the closest station. An average was taken for each year, and a predicted figure was taken for the year 2021.
Related Articles