Which cities have the best community spirit and pride in their neighbourhoods?
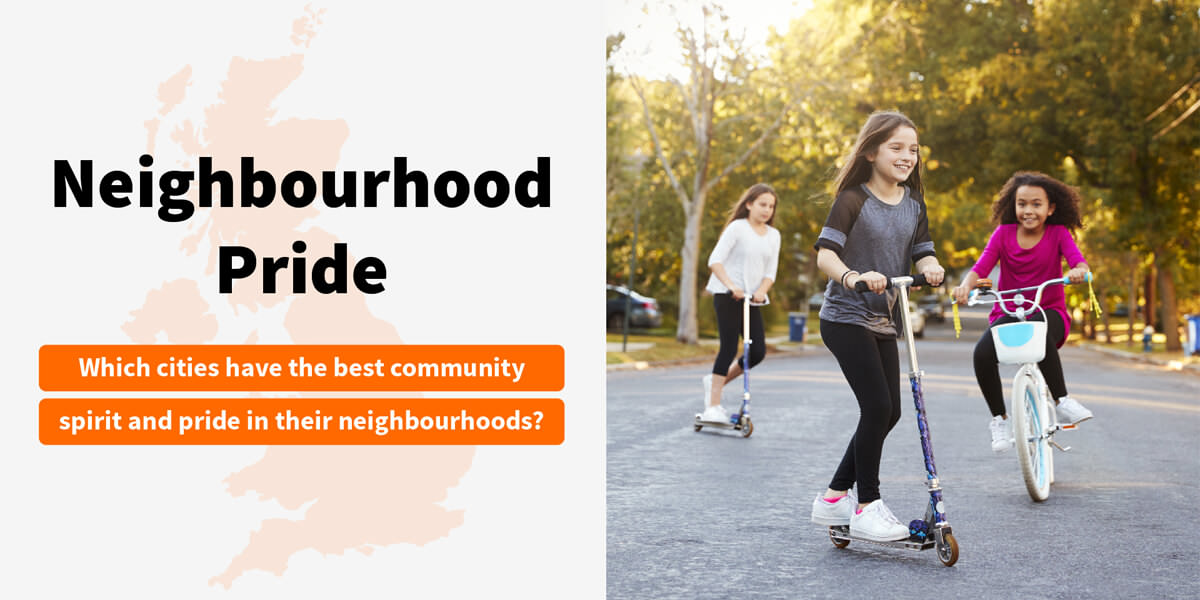
The towns and cities in which we live can become part of our identity, with people taking a great deal of pride in their neighbourhoods. Whether it's in the community spirit, the effort to go green or even the cleanliness of the area, there are many things that can help residents feel proud of the place they live in.
At Buildworld, we like to help people feel proud of their homes but we want to know where people take the most pride in their communities and neighbourhoods. With this in mind, we looked at a number of factors in cities around the UK to find out which places have the most neighbourhood pride.
The UK cities with the most pride in their neighbourhood
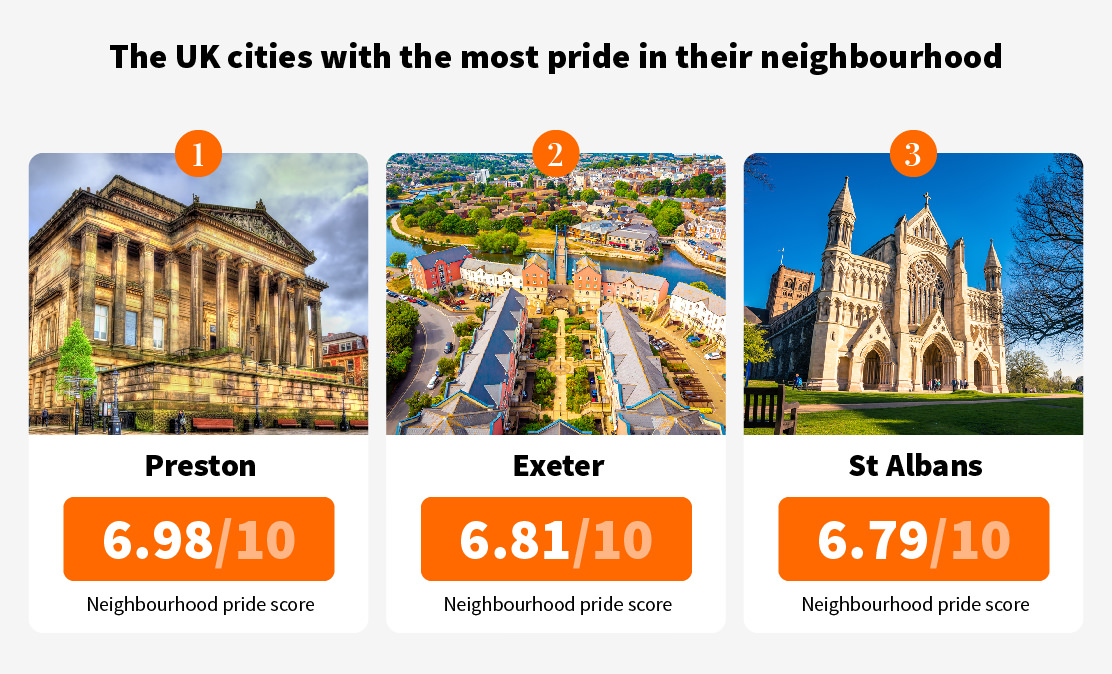
1. Preston - 6.98/10 neighbourhood pride score
Located in England's North West is the city of Preston and our top scorer for neighbourhood pride. This city scored particularly well when it came to the quality of green and parks in the local area, something it may have the local Area of Outstanding Natural Beauty, the Forest of Bowland to thank for.
2. Exeter - 6.81/10 neighbourhood pride score
At the other end of the country is the city of Exeter, located in Devon. This is a city known for its prestigious educational institutions as well as beautiful architecture, and now for its neighbourhood pride. The city scored particularly well when looking at the investment made into environmental and regulatory services by the council, accounting for 31.9% of their total services spend.
3. St Albans - 6.79/10 neighbourhood pride score
Following closely behind in third place is the city of St Albans in Hertfordshire, just north of London. This city scored well when it came to the number of local 'It's Your Neighbourhood' and Britain in Bloom groups, with a total of 122 groups, equating to 8.67 per 10,000 people.
The cleanest cities in the UK
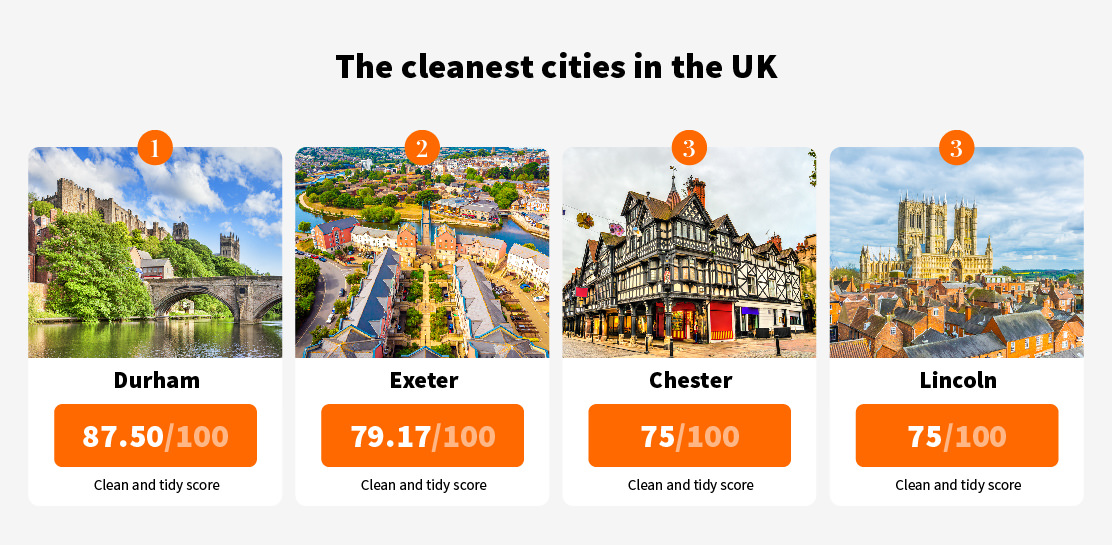
Clean streets can go a long way to maintaining a sense of neighbourhood pride within a community. Not only does it contribute to this sense of pride, but it also suggests that residents and the local authority are invested in keeping the area clean and tidy.
1. Durham - 87.50/100 clean and tidy score
2. Exeter - 79.17/100 clean and tidy score
3. Chester - 75/100 clean and tidy score
3. Lincoln - 75/100 clean and tidy score
The UK cities with the best parks and green spaces
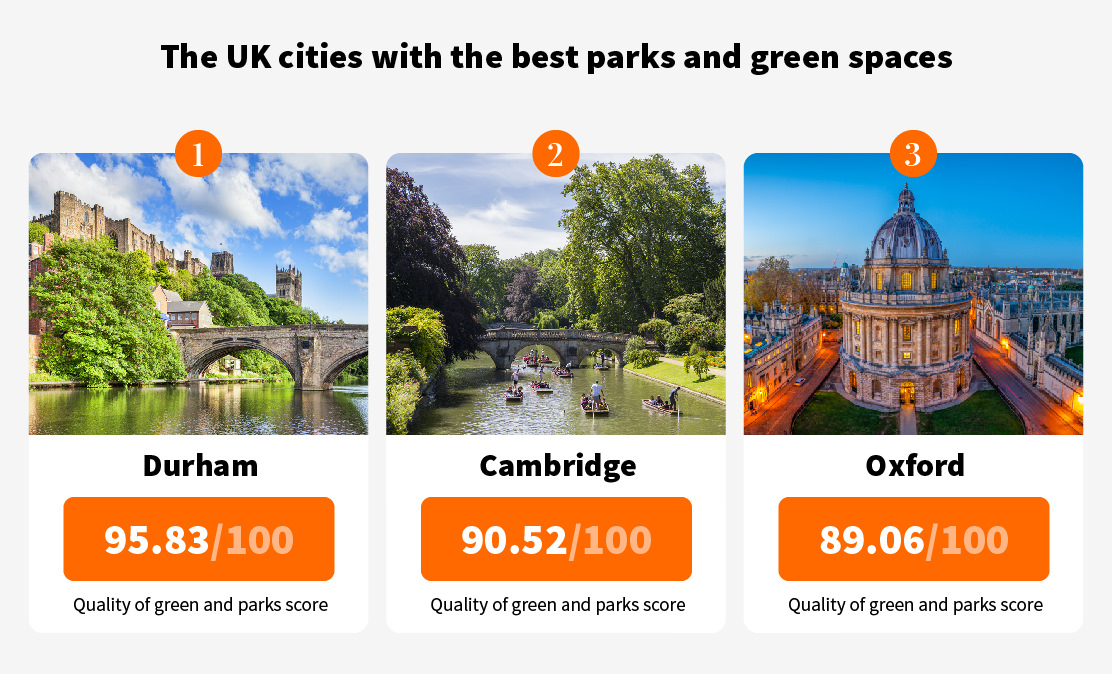
Plenty of parks and green spaces are often an important factor in creating community spirit. These areas offer the perfect place for social gatherings amongst friends, families and neighbours. So, where can you find the highest quality of green and parks?
1. Durham - 95.83/100 quality of green and parks score
2. Cambridge - 90.52/100 quality of green and parks score
3. Oxford - 89.06/100 quality of green and parks score
The UK cities with the most interest in recycling
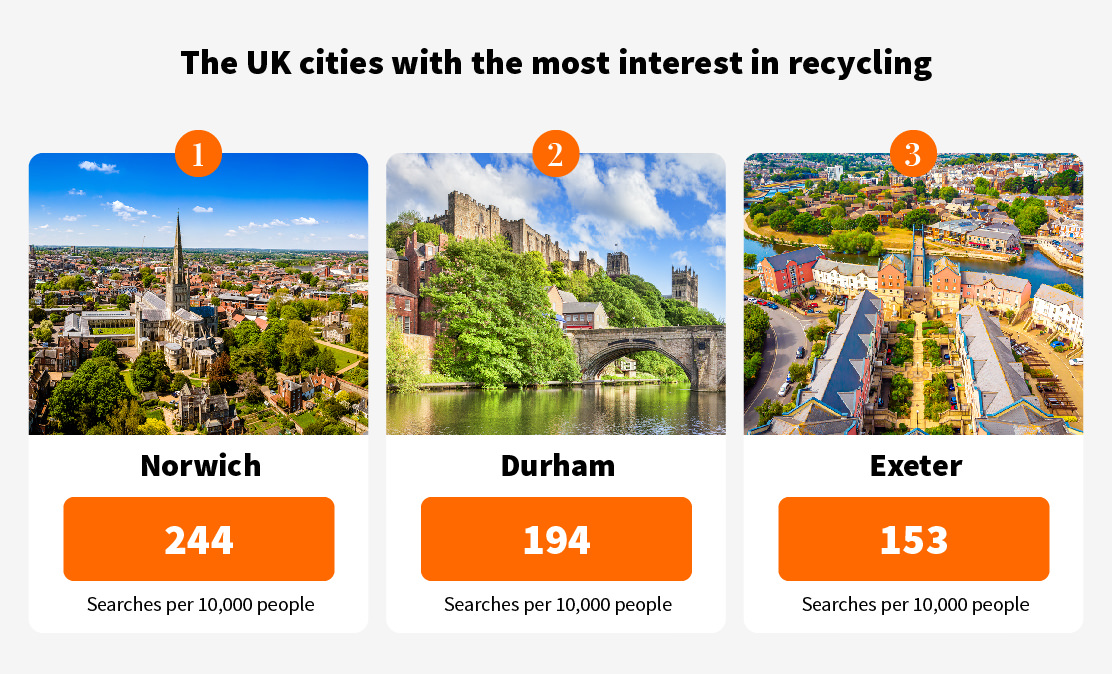
Keeping a city green is a great way to enter into a sense of neighbourhood pride and recycling is one of the easiest ways to stay eco-friendly. With this in mind, we wanted to find out which city is home to residents who are most interested in recycling so we looked at the number of Google searches for the term 'recycling near me' in each area.
1. Norwich - 244 searches per 10,000 people
2. Durham - 194 searches per 10,000 people
3. Exeter - 153 searches per 10,000 people
The top UK cities for council spending on environmental and regulatory services
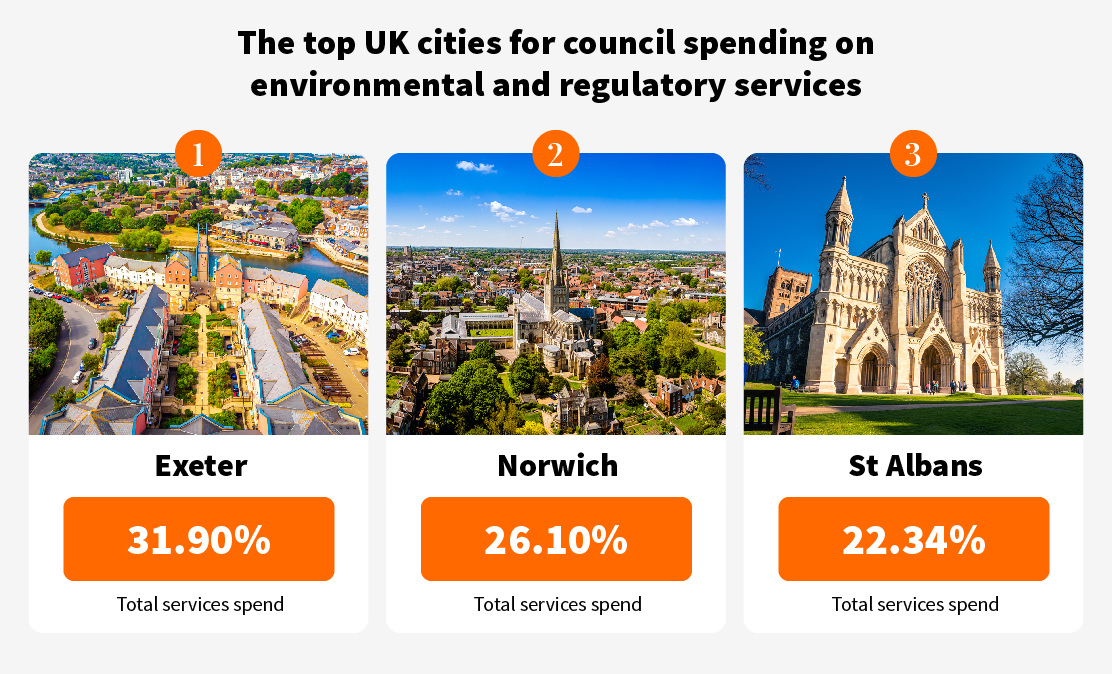
Local councils are able to divide their funding as they see fit, choosing where to assign funds. When we look at the breakdown of these we can see which areas have the highest percentage assigned to environmental services. These services cover things such as environmental health, waste management and street cleaning.
1. Exeter - 31.90% of total services spend
2. Norwich - 26.10% of total services spend
3. St Albans - 22.34% of total services spend
The top UK cities for local community groups
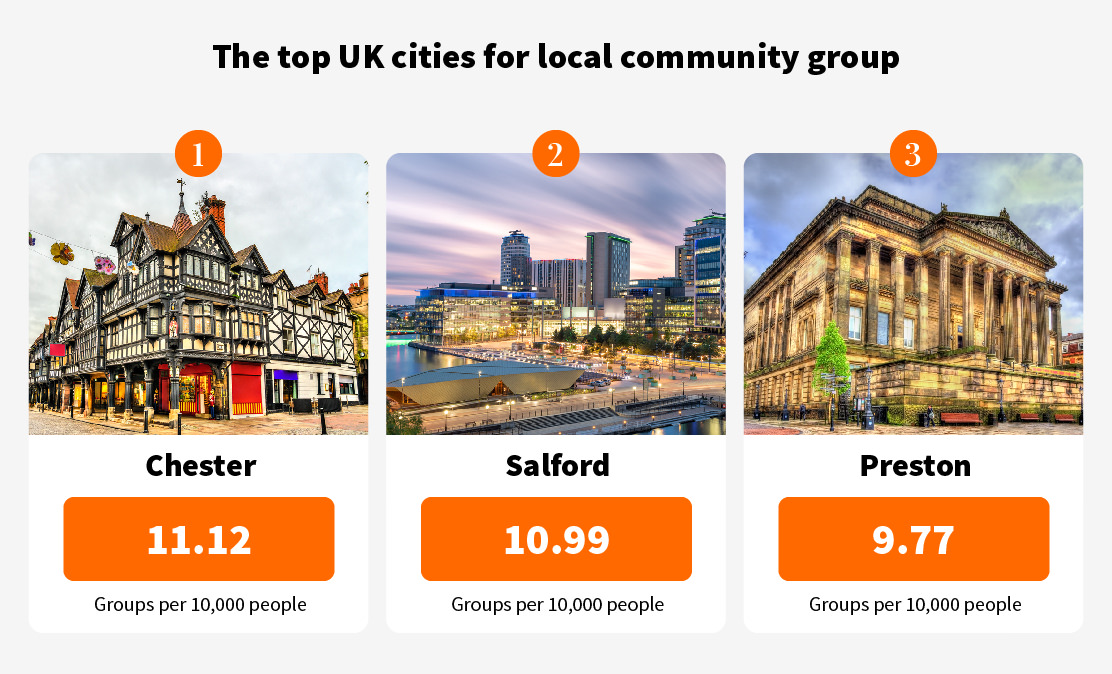
Around the country, there are countless community groups that bring neighbourhoods together in order to have a positive impact on the local community. We looked at the number of 'It's Your Neighbourhood' groups and Britain in Bloom groups in each area. These groups do things such as cleaning local areas, creating green spaces and planting flowers in unused patches.
1. Chester - 11.12 groups per 10,000 people
2. Salford - 10.99 groups per 10,000 people
3. Preston - 9.77 groups per 10,000 people
The UK cities with the most pride in their neighbourhood ranked
| Town/City |
|
|
|
|
|
|
|
|
|
|
|---|---|---|---|---|---|---|---|---|---|---|
| 1 Preston | 62.50 | 81.25 | 1,530 | 109 | 16.96% | 95 | 6.78 | 42 | 3.00 | 6.98 |
| 2 Exeter | 79.17 | 81.25 | 1,800 | 153 | 31.90% | 47 | 3.99 | 9 | 0.76 | 6.81 |
| 3 St Albans | 68.75 | 81.25 | 1,650 | 117 | 22.34% | 99 | 7.04 | 23 | 1.64 | 6.79 |
| 4 Durham | 87.50 | 95.83 | 1,830 | 194 | 6.90% | 47 | 4.98 | 3 | 0.32 | 6.30 |
| 5 Chester | 75.00 | 75.00 | 730 | 80 | 6.45% | 89 | 9.70 | 13 | 1.42 | 5.98 |
| 6 Bath | 60.00 | 80.00 | 1,250 | 141 | 8.76% | 71 | 7.99 | 7 | 0.79 | 5.76 |
| 7 Norwich | 64.06 | 64.06 | 3,230 | 244 | 26.10% | 0 | 0.00 | 4 | 0.30 | 5.49 |
| 8 Worcester | 66.67 | 75.00 | 550 | 56 | 5.18% | 47 | 4.76 | 10 | 1.01 | 4.62 |
| 9 Cambridge | 73.28 | 90.52 | 1,330 | 107 | 5.35% | 0 | 0.00 | 3 | 0.24 | 4.41 |
| 10 Chelmsford | 70.83 | 79.17 | 620 | 37 | 16.86% | 12 | 0.71 | 8 | 0.48 | 4.39 |
| 11 Salford | 50.00 | 50.00 | 430 | 18 | 2.54% | 217 | 9.28 | 40 | 1.71 | 4.26 |
| 12 Hereford | 50.00 | 75.00 | 420 | 71 | 6.38% | 17 | 2.89 | 7 | 1.19 | 4.25 |
| 13 lisle | 58.33 | 58.33 | 540 | 50 | 20.34% | 16 | 1.49 | 9 | 0.84 | 4.14 |
| 14 Oxford | 70.31 | 89.06 | 930 | 61 | 3.79% | 2 | 0.13 | 8 | 0.53 | 4.09 |
| 15 Lincoln | 75.00 | 77.78 | 720 | 77 | 3.74% | 6 | 0.64 | 5 | 0.53 | 4.05 |
| 16 York | 62.50 | 75.00 | 1,140 | 58 | 5.27% | 10 | 0.50 | 25 | 1.26 | 4.02 |
| 17 Derby | 51.92 | 77.08 | 1,090 | 44 | 6.11% | 67 | 2.69 | 20 | 0.80 | 3.93 |
| 18 Sheffield | 59.72 | 86.11 | 4,390 | 79 | 4.93% | 27 | 0.49 | 8 | 0.14 | 3.83 |
| 19 Liverpool | 47.12 | 82.00 | 2,700 | 58 | 3.62% | 120 | 2.57 | 20 | 0.43 | 3.72 |
| 20 Nottingham | 58.33 | 70.45 | 1,720 | 56 | 3.97% | 68 | 2.22 | 16 | 0.52 | 3.63 |
| 21 Newcastle upon Tyne | 58.70 | 80.43 | 1,650 | 59 | 5.22% | 35 | 1.25 | 1 | 0.04 | 3.60 |
| 22 Kingston upon Hull | 57.14 | 71.43 | 1,090 | 43 | 8.19% | 20 | 0.78 | 15 | 0.59 | 3.57 |
| 23 Brighton & Hove | 57.29 | 85.23 | 1,270 | 46 | 5.58% | 13 | 0.48 | 1 | 0.04 | 3.52 |
| 24 Leicester | 58.33 | 60.42 | 2,550 | 77 | 4.97% | 65 | 1.97 | 16 | 0.49 | 3.48 |
| 25 Plymouth | 58.33 | 73.61 | 980 | 38 | 7.97% | 21 | 0.82 | 7 | 0.27 | 3.46 |
| 26 Manchester | 36.98 | 52.72 | 3,430 | 68 | 3.91% | 216 | 4.29 | 38 | 0.76 | 3.23 |
| 27 Southampton | 53.12 | 75.00 | 960 | 41 | 4.88% | 5 | 0.21 | 3 | 0.13 | 3.08 |
| 28 Leeds | 44.17 | 68.33 | 3,010 | 40 | 5.33% | 36 | 0.48 | 34 | 0.45 | 2.94 |
| 29 Peterborough | 45.83 | 58.33 | 1,080 | 59 | 4.48% | 5 | 0.27 | 6 | 0.33 | 2.69 |
| 30 Birmingham | 41.25 | 58.55 | 6,500 | 60 | 4.69% | 58 | 0.53 | 18 | 0.16 | 2.57 |
| 31 Sunderland | 25.00 | 62.50 | 750 | 27 | 6.50% | 38 | 1.38 | 3 | 0.11 | 2.34 |
| 32 Wolverhampton | 12.50 | 50.00 | 1,090 | 44 | 4.57% | 54 | 2.16 | 16 | 0.64 | 2.14 |
| 33 Stoke-on-Trent | 16.67 | 41.67 | 1,040 | 42 | 5.63% | 44 | 1.77 | 19 | 0.76 | 2.04 |
| 34 Portsmouth | 31.82 | 45.00 | 1,120 | 55 | 5.79% | 5 | 0.24 | 3 | 0.15 | 1.98 |
Methodology:
Looking at a number of factors to signify community spirit and neighbourhood pride, we assigned a normalised score out of ten for each factor, taking an average of each of these scores to give an overall score out of ten.
Clean & tidy and quality of green and parks scores were taken from user-submitted scores at Numbeo.
Be the pride of your neighbourhood with the help of sustainable products from Buildworld. The range of external doors, roof windows, interior doors and coloured doors available on our website will match every type of decor you can think of. Plus, their superior durability and multi-year guarantees from the manufacturers ensures that these products will last you a lifetime.
Search numbers were taken from Google keyword planner, with the number of searches for the phrase 'recycling near me' in each city during the time period of December 2020 - November 2021. These volumes were then normalised against the population numbers for each city.
Council expenditure on environmental and regulatory services was taken from the official government website and relates to the time period of 2020-2021.
The number of It's Your Neighbourhood groups and Britain in Bloom groups were taken from the Royal Horticultural Society search tool.
Related Articles


Category
Study & ResearchPosted On
13th November 2023

